


'%3e%3cg%20clip-path='url(%23clip1_292_2742)'%3e%3cpath%20d='M8.57025%2024.0198C8.57025%2024.3363%208.316%2024.5898%208.00025%2024.5898H2.28525C1.52325%2024.5898%201.52325%2023.4453%202.28525%2023.4453H8.00025C8.31675%2023.4453%208.57025%2023.7033%208.57025%2024.0198ZM8.00025%2021.1601H6.85575C6.09375%2021.1601%206.09375%2022.3046%206.85575%2022.3046H8.00025C8.76225%2022.3046%208.76225%2021.1601%208.00025%2021.1601ZM2.28525%2022.3046H4.5705C5.3325%2022.3046%205.3325%2021.1601%204.5705%2021.1601H2.28525C1.52325%2021.1601%201.52325%2022.3046%202.28525%2022.3046ZM8.00025%2018.8748H2.28525C1.52325%2018.8748%201.52325%2020.0193%202.28525%2020.0193H8.00025C8.76225%2020.0193%208.76225%2018.8748%208.00025%2018.8748ZM15.9997%2016.5896H5.71425C4.95225%2016.5896%204.95225%2017.7341%205.71425%2017.7341H15.9997C16.7617%2017.7341%2016.7617%2016.5896%2015.9997%2016.5896ZM2.28525%2017.7341H3.42975C4.19175%2017.7341%204.19175%2016.5896%203.42975%2016.5896H2.28525C1.52325%2016.5896%201.52325%2017.7341%202.28525%2017.7341ZM19.4295%2014.3043H15.9997C15.2377%2014.3043%2015.2377%2015.4451%2015.9997%2015.4451H19.4295C20.1915%2015.4451%2020.1915%2014.3043%2019.4295%2014.3043ZM9.14475%2015.4451H13.7152C14.4772%2015.4451%2014.4772%2014.3043%2013.7152%2014.3043H9.14475C8.38275%2014.3043%208.38275%2015.4451%209.14475%2015.4451ZM2.28525%2015.4451H6.85575C7.61775%2015.4451%207.61775%2014.3043%206.85575%2014.3043H2.28525C1.52325%2014.3043%201.52325%2015.4451%202.28525%2015.4451ZM20.5702%2012.0198H11.4292C10.6672%2012.0198%2010.6672%2013.1606%2011.4292%2013.1606H20.5702C21.3322%2013.1606%2021.3322%2012.0198%2020.5702%2012.0198ZM9.71475%2012.5898C9.71475%2012.2733%209.45675%2012.0198%209.14475%2012.0198H5.715C4.953%2012.0198%204.953%2013.1606%205.715%2013.1606H9.14475C9.4575%2013.1606%209.71475%2012.9056%209.71475%2012.5898ZM2.28525%2013.1598H3.42975C4.19175%2013.1598%204.19175%2012.0191%203.42975%2012.0191H2.28525C1.52325%2012.0191%201.52325%2013.1598%202.28525%2013.1598ZM21.7147%209.73459H15.9997C15.2377%209.73459%2015.2377%2010.8753%2015.9997%2010.8753H21.7147C22.4767%2010.8753%2022.4767%209.73459%2021.7147%209.73459ZM2.28525%2010.8753H8.00025C8.76225%2010.8753%208.76225%209.73459%208.00025%209.73459H2.28525C1.52325%209.73459%201.52325%2010.8753%202.28525%2010.8753ZM15.4297%208.01934C15.4297%208.33209%2015.684%208.58934%2015.9997%208.58934H21.7147C22.4767%208.58934%2022.4767%207.44484%2021.7147%207.44484H15.9997C15.6832%207.44484%2015.4297%207.70284%2015.4297%208.01934ZM6.85575%207.44559C6.09375%207.44559%206.09375%208.59009%206.85575%208.59009H8.00025C8.76225%208.59009%208.76225%207.44559%208.00025%207.44559H6.85575ZM2.28525%208.59009H4.5705C5.3325%208.59009%205.3325%207.44559%204.5705%207.44559H2.28525C1.52325%207.44559%201.52325%208.59009%202.28525%208.59009ZM18.8557%205.73409C18.8557%206.04684%2019.1137%206.30409%2019.4302%206.30409H20.571C21.333%206.30409%2021.333%205.15959%2020.571%205.15959H19.4302C19.1137%205.15959%2018.8602%205.41759%2018.8602%205.73409H18.8557ZM17.715%205.73409C17.715%205.41759%2017.457%205.15959%2017.145%205.15959H12.5707C11.8087%205.15959%2011.8087%206.30409%2012.5707%206.30409H17.1412C17.4577%206.30409%2017.715%206.04609%2017.715%205.73409ZM2.28525%206.30484H10.2855C11.0475%206.30484%2011.0475%205.16034%2010.2855%205.16034H2.28525C1.52325%205.16034%201.52325%206.30484%202.28525%206.30484ZM7.4295%203.44509C7.4295%203.76159%207.68375%204.01959%207.9995%204.01959H19.4295C20.1915%204.01959%2020.1915%202.87509%2019.4295%202.87509H7.9995C7.683%202.87509%207.4295%203.13309%207.4295%203.44509ZM2.28525%204.01959H5.715C6.477%204.01959%206.477%202.87509%205.715%202.87509H2.28525C1.52325%202.87509%201.52325%204.01959%202.28525%204.01959ZM2.28525%201.73434H15.9997C16.7617%201.73434%2016.7617%200.589844%2015.9997%200.589844H2.28525C1.52325%200.589844%201.52325%201.73434%202.28525%201.73434Z'%20fill='%23000'/%3e%3c/g%3e%3c/g%3e%3cdefs%3e%3cclipPath%20id='clip0_292_2742'%3e%3crect%20width='24'%20height='24'%20fill='white'%20transform='translate(0%200.589844)'/%3e%3c/clipPath%3e%3cclipPath%20id='clip1_292_2742'%3e%3crect%20width='24'%20height='24'%20fill='white'%20transform='translate(0%200.589844)'/%3e%3c/clipPath%3e%3c/defs%3e%3c/svg%3e)


CityLAB 2024
*Annual review report* for CityLAB Berlin for the year 2024
Microsite 2025

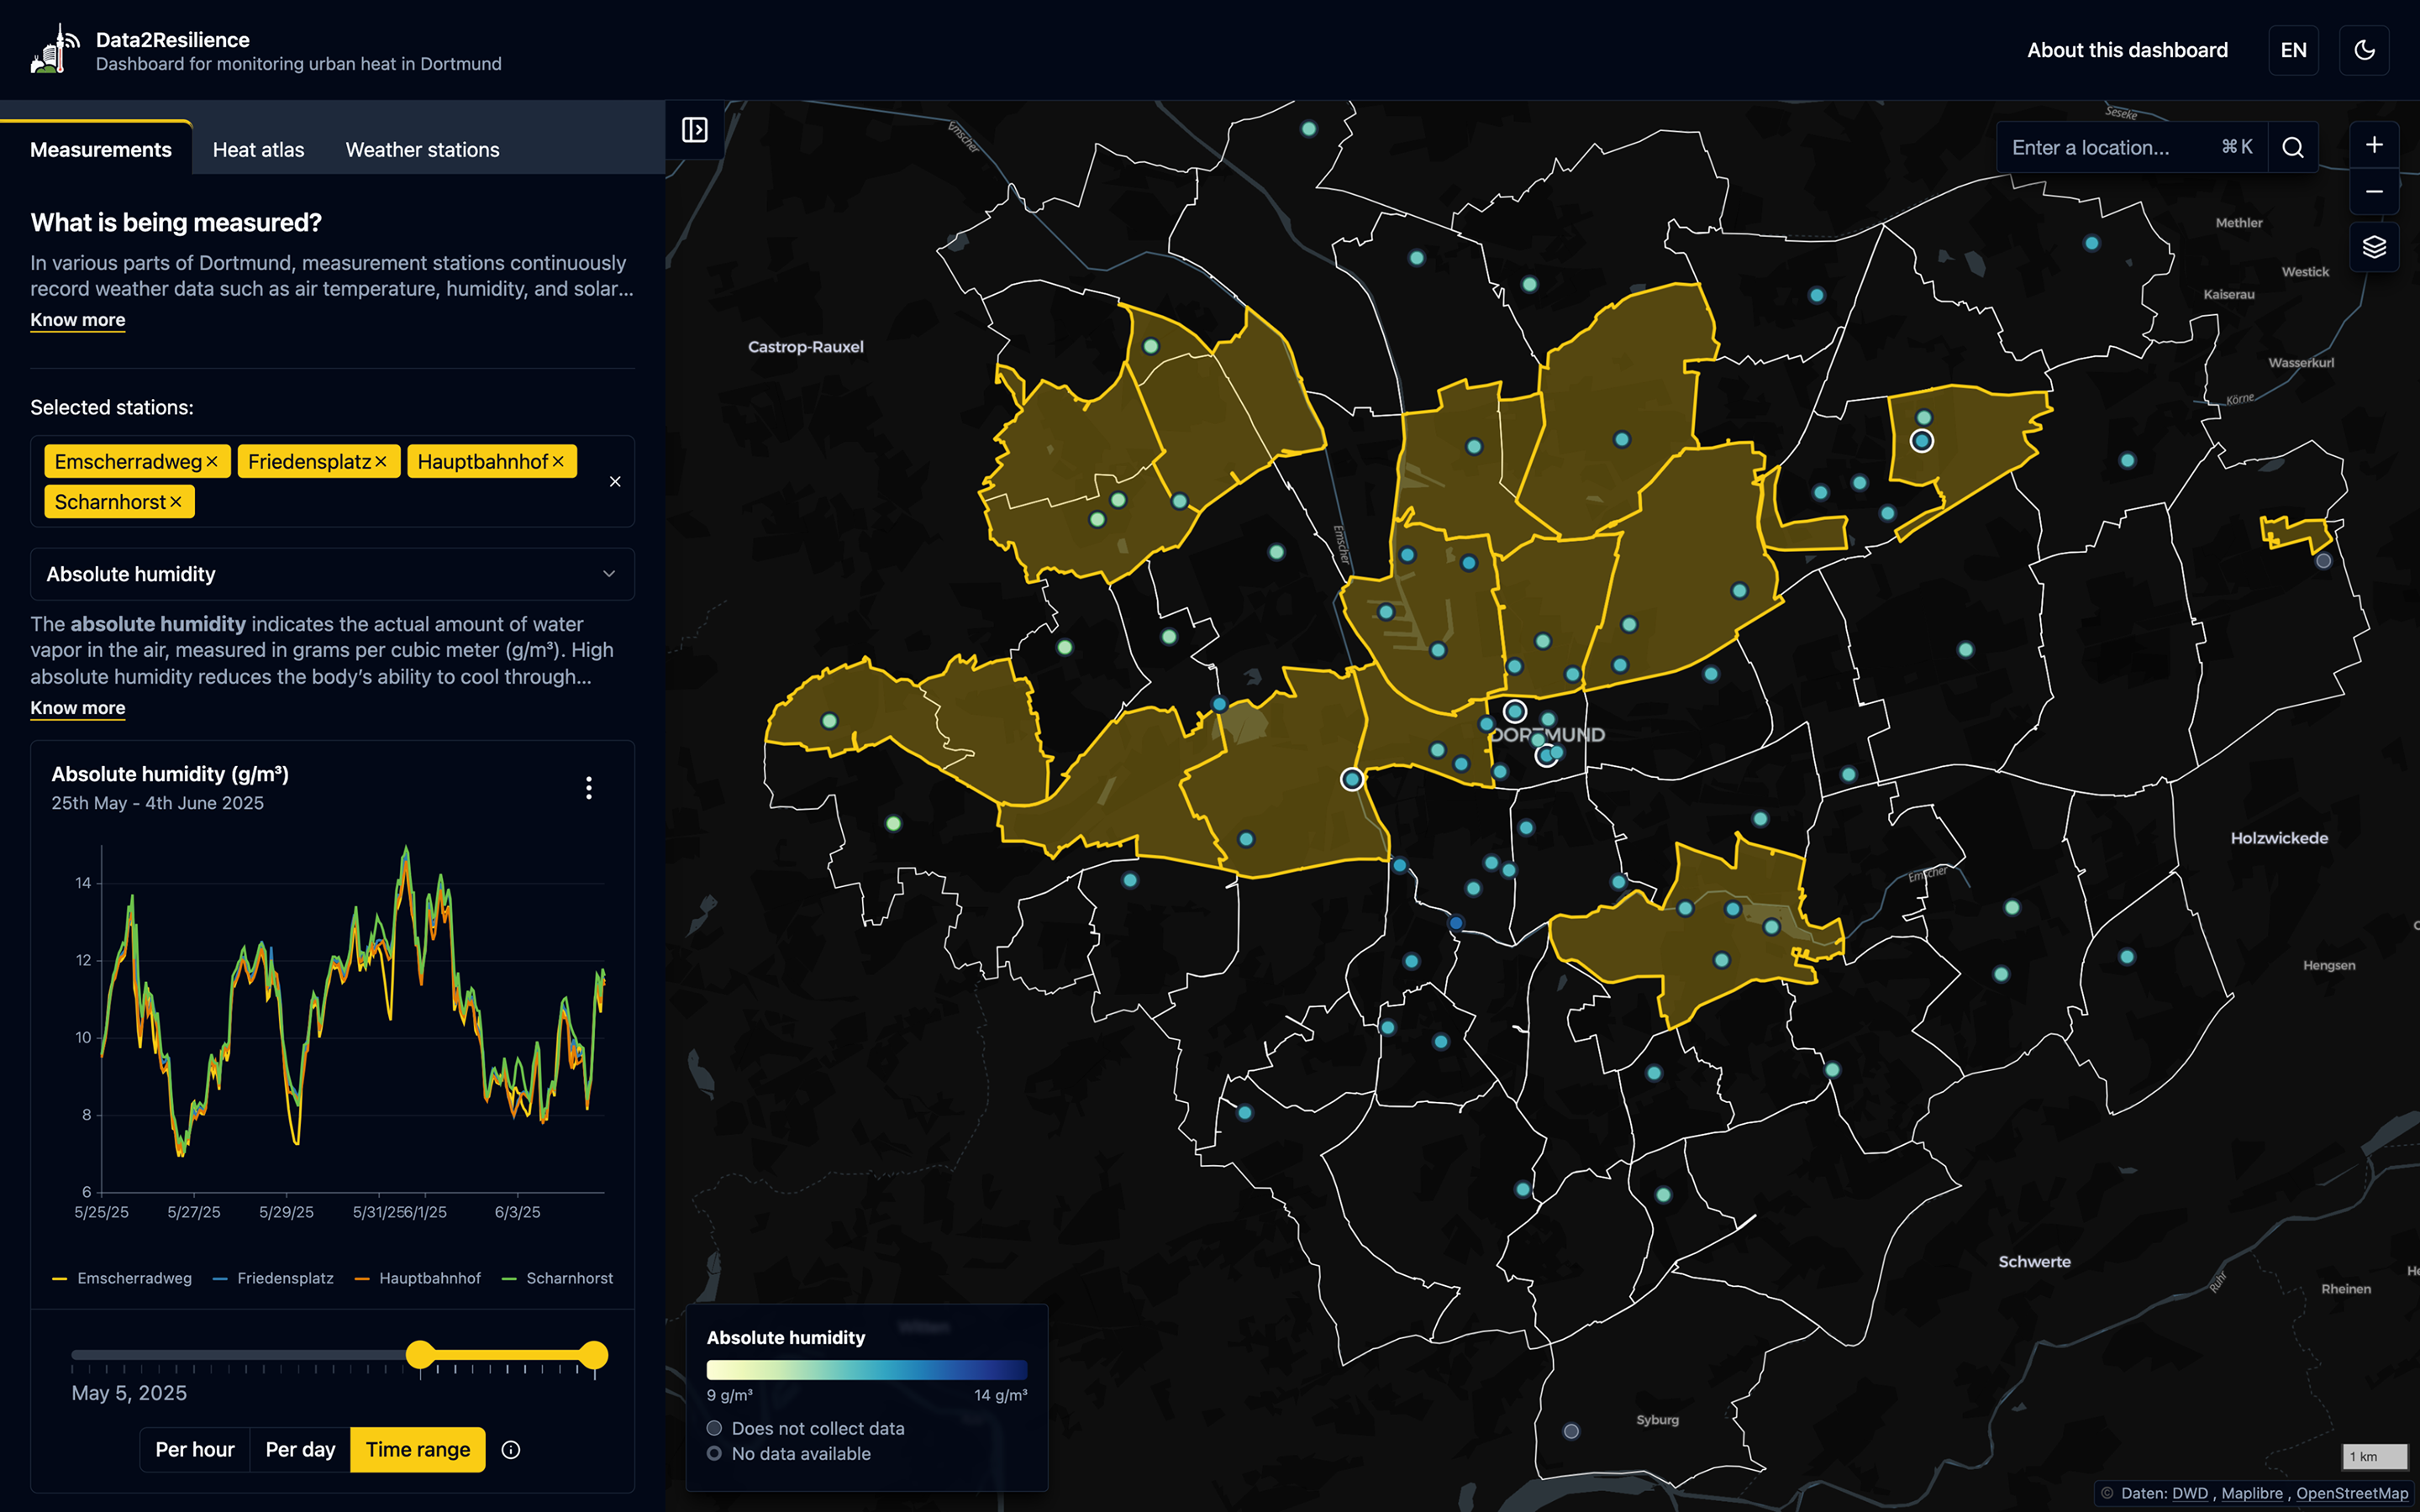

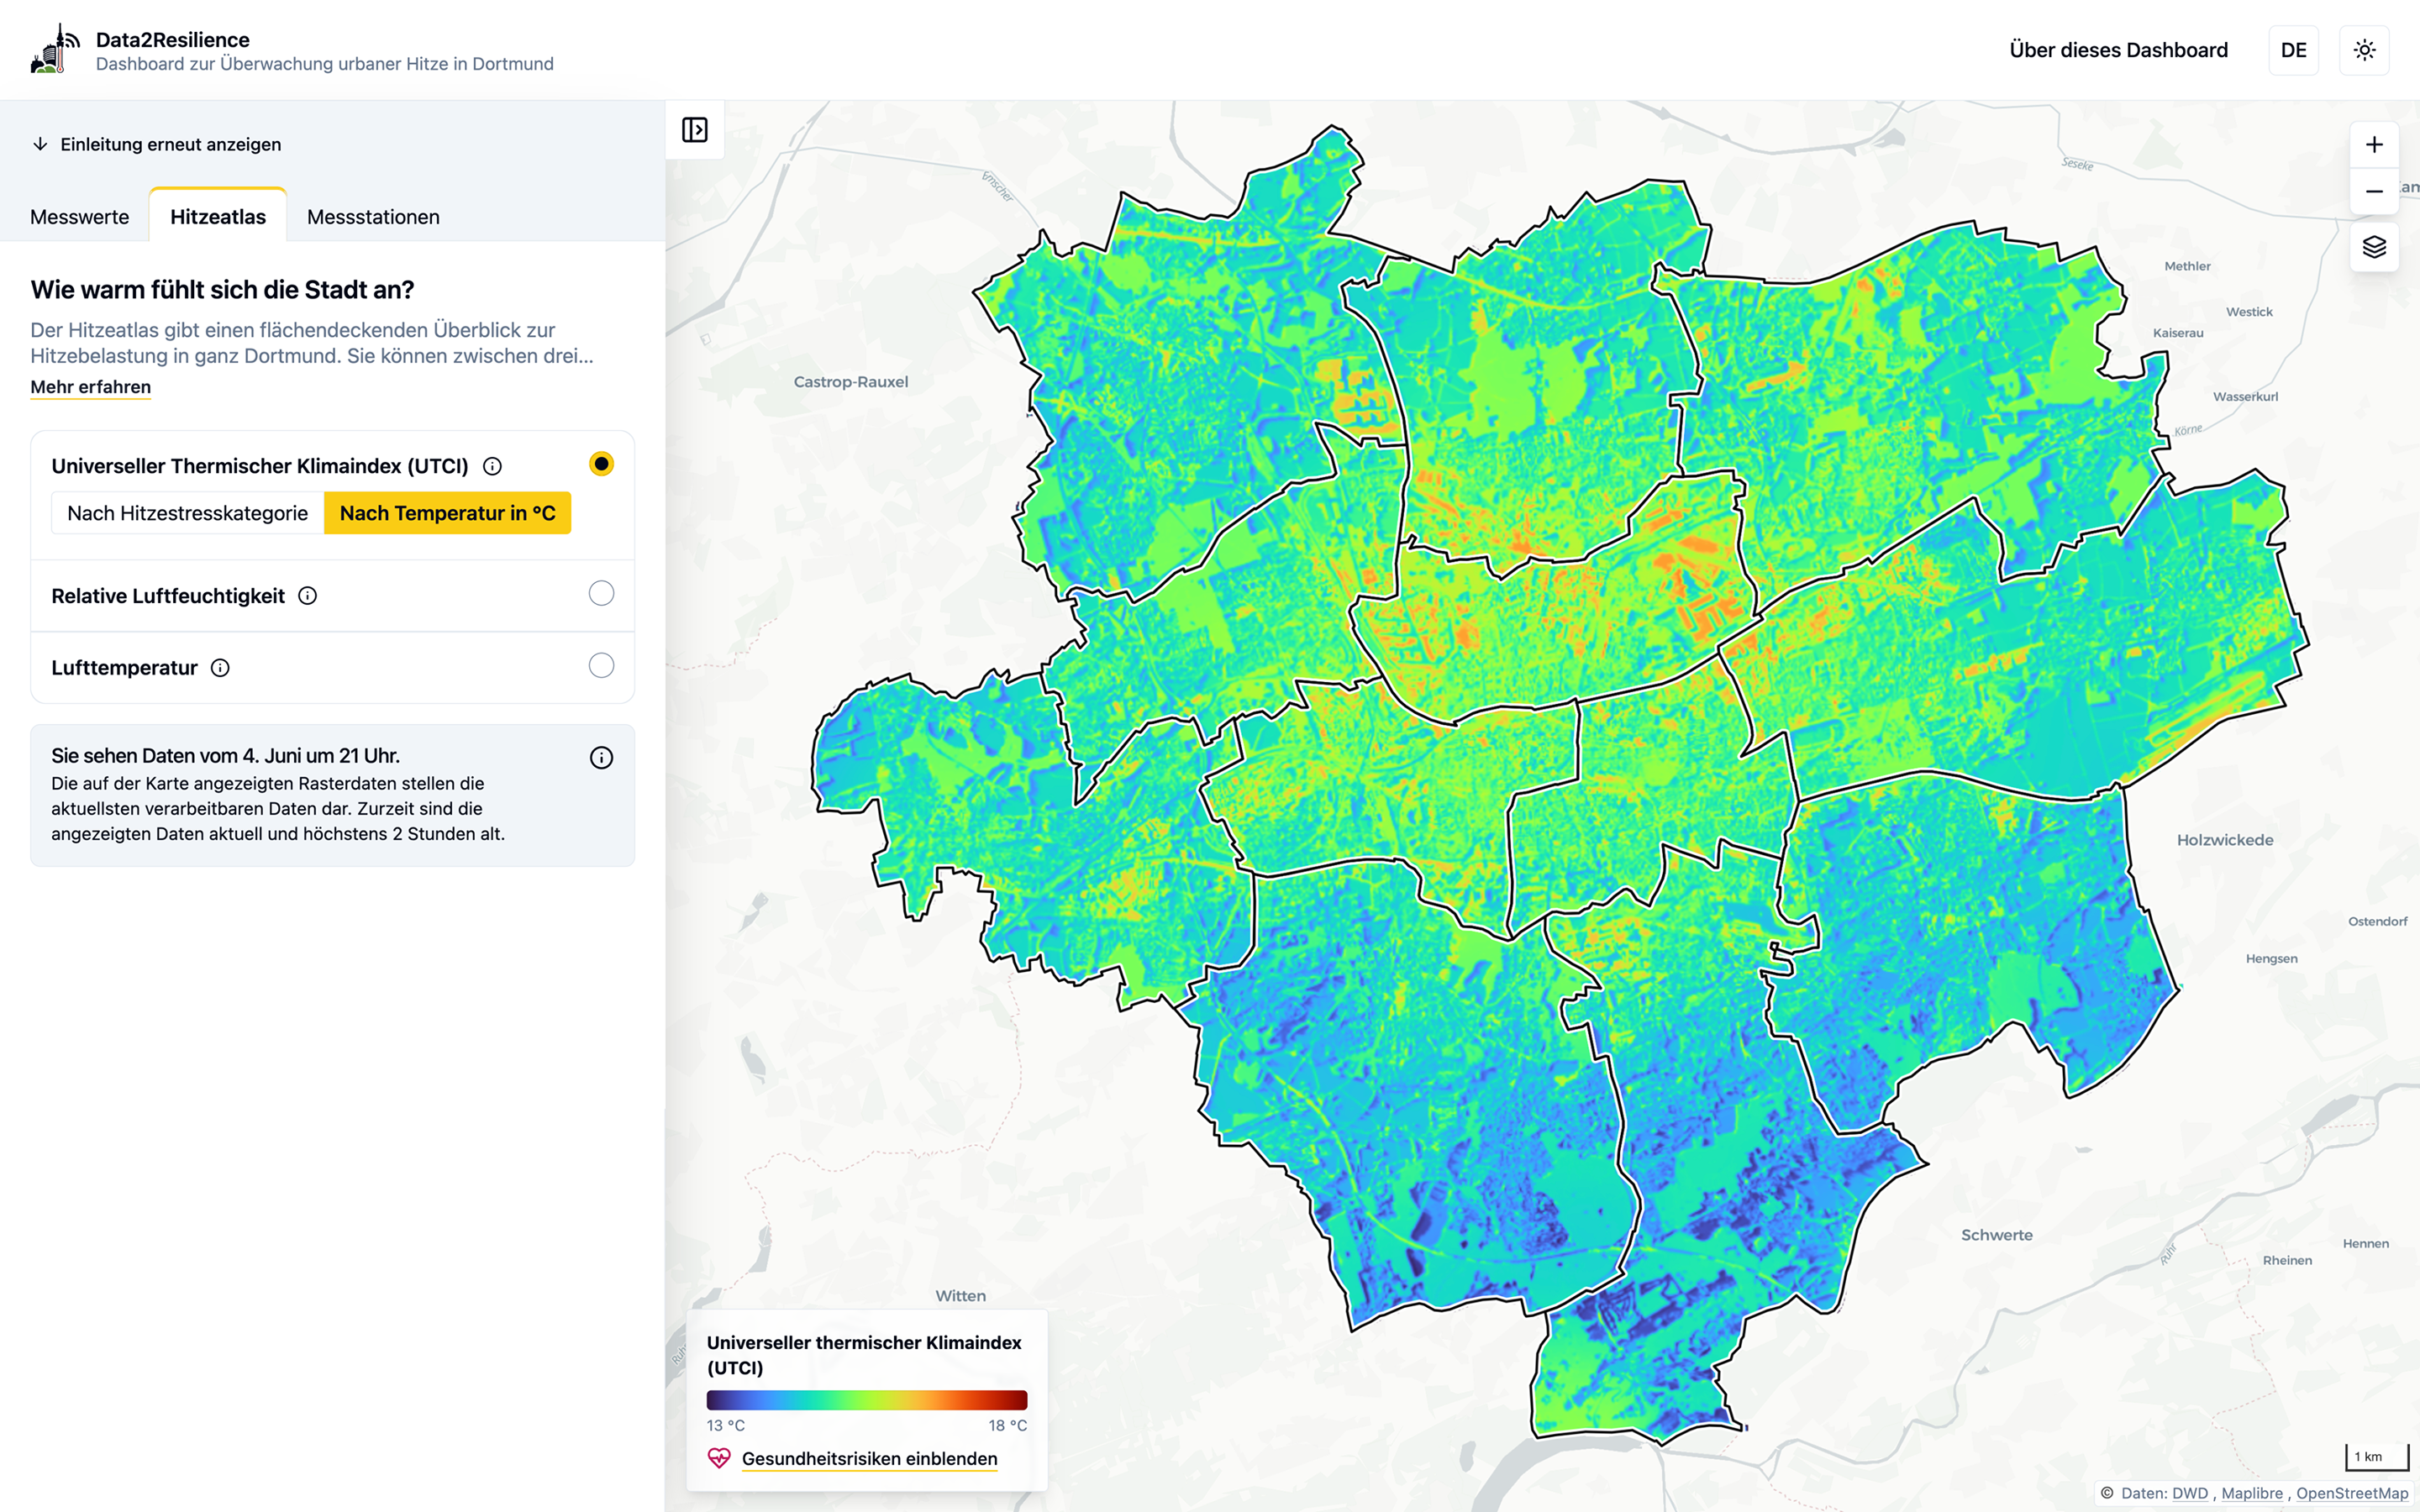
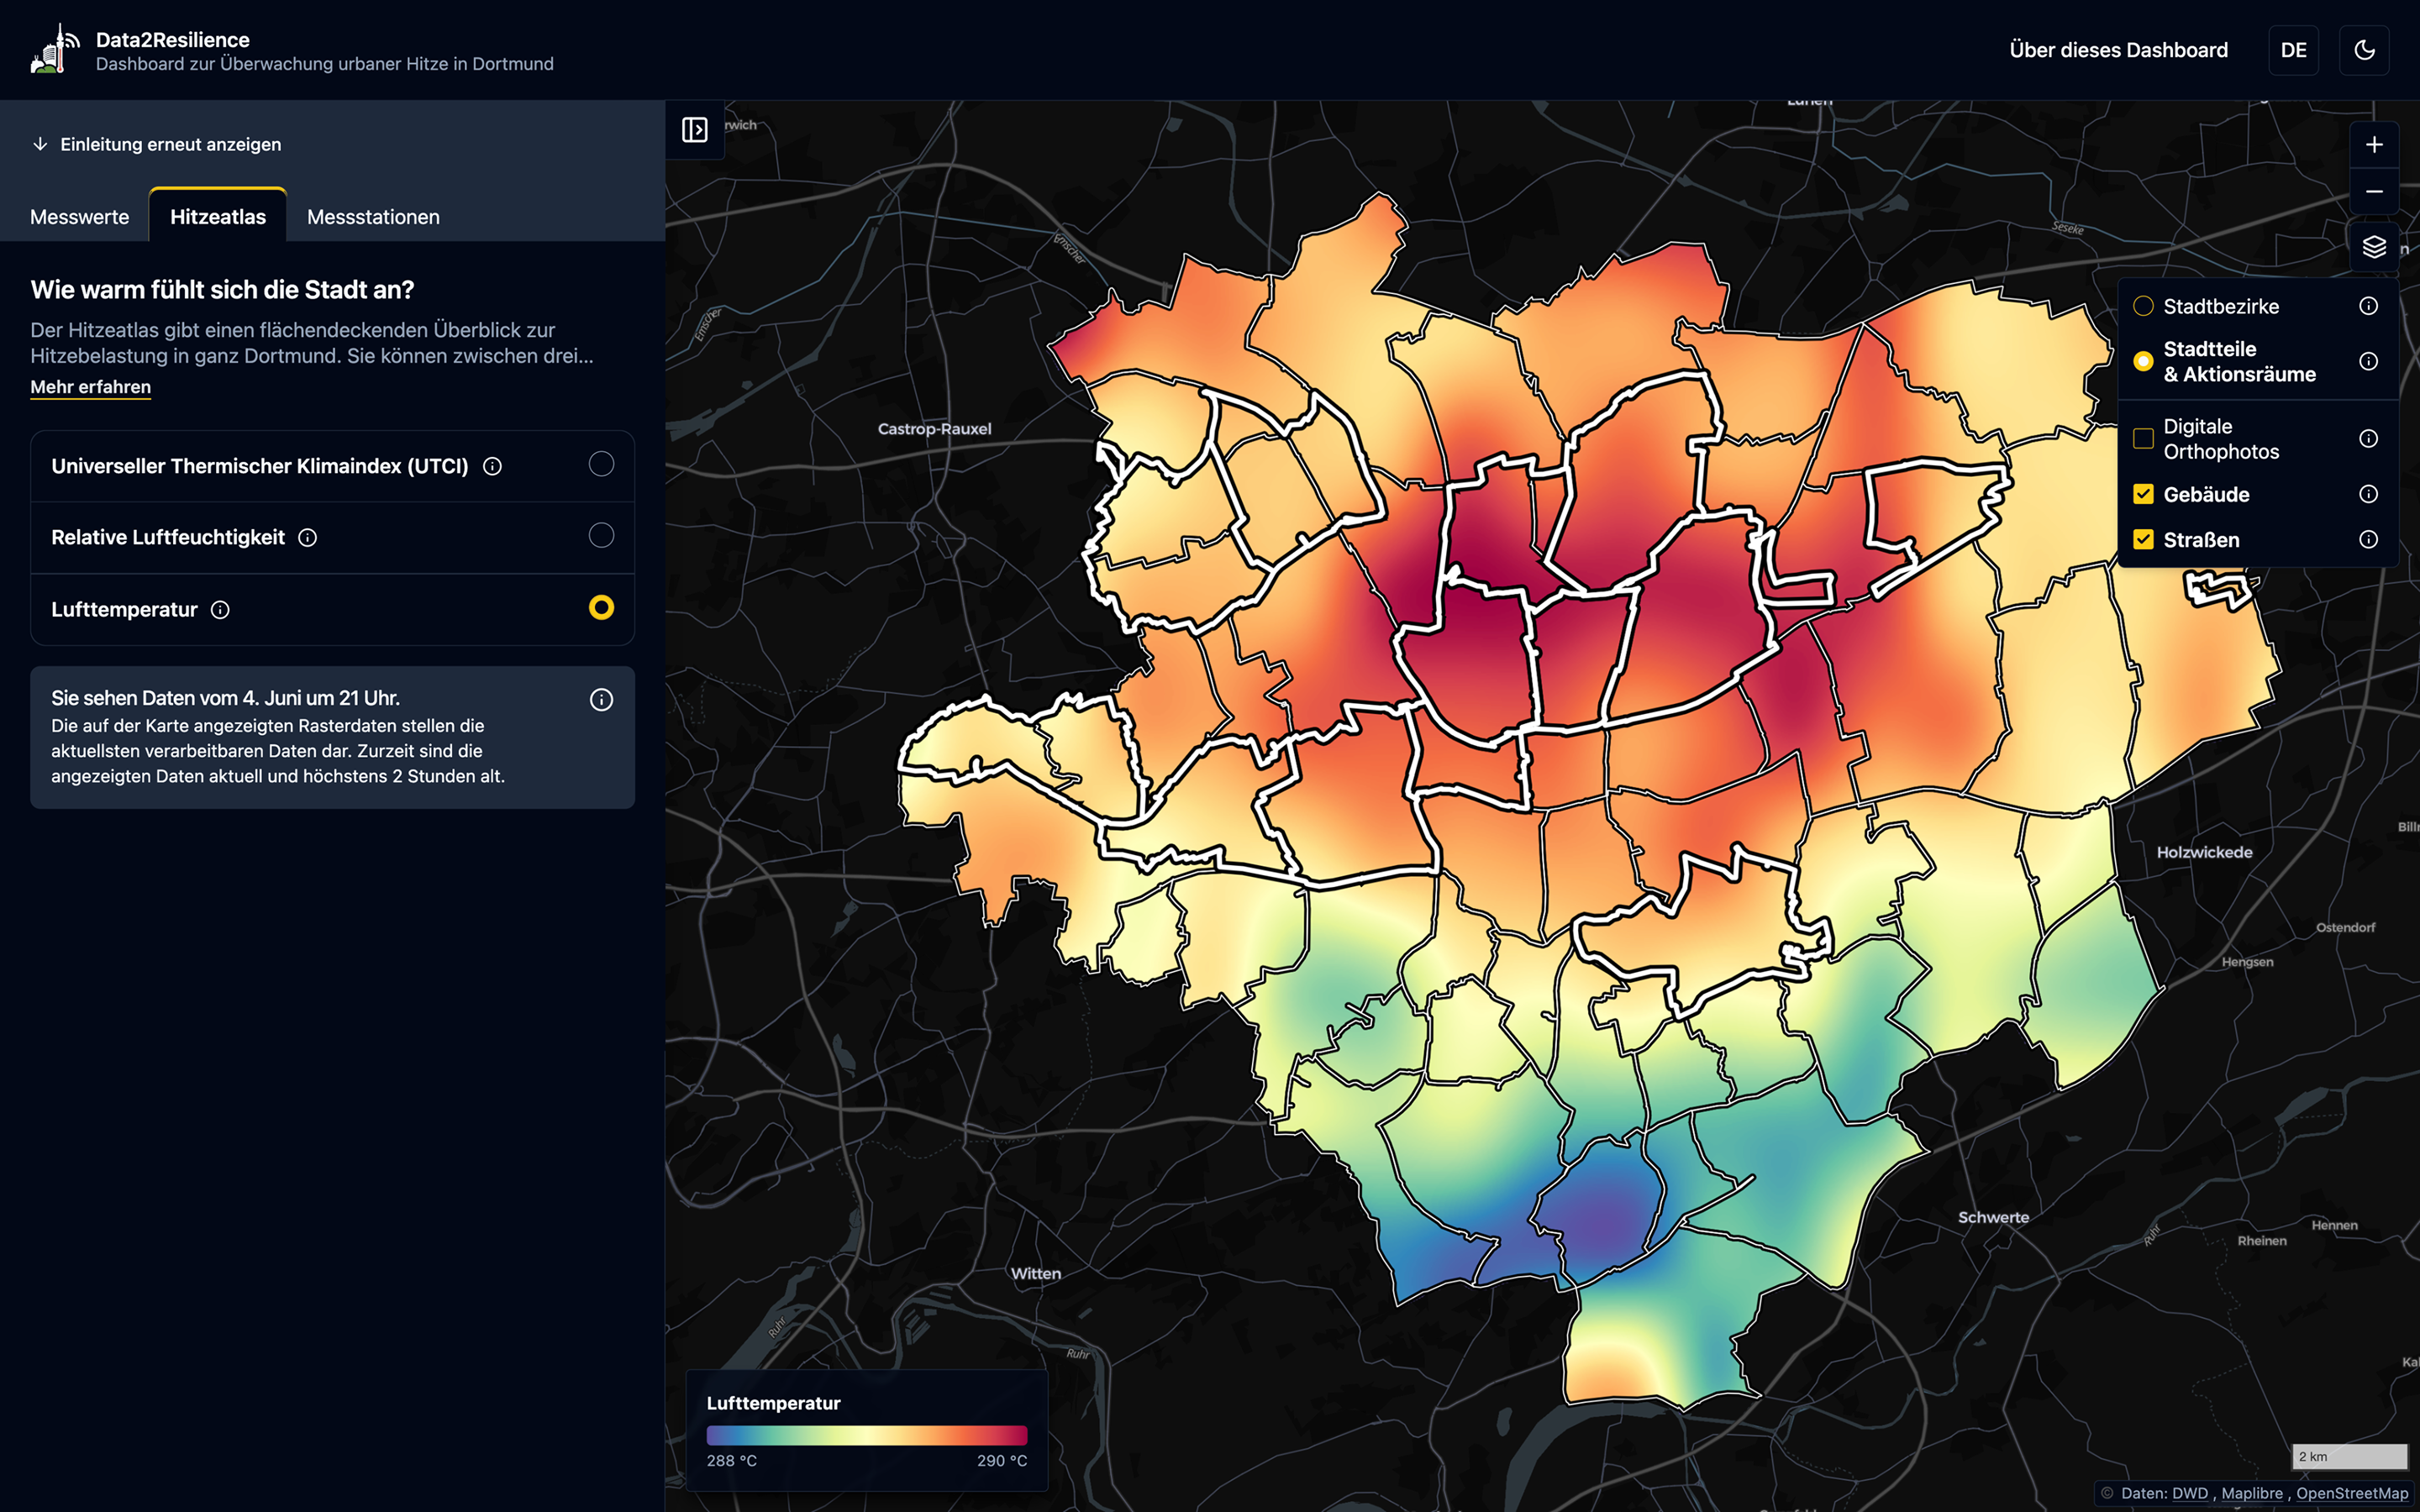
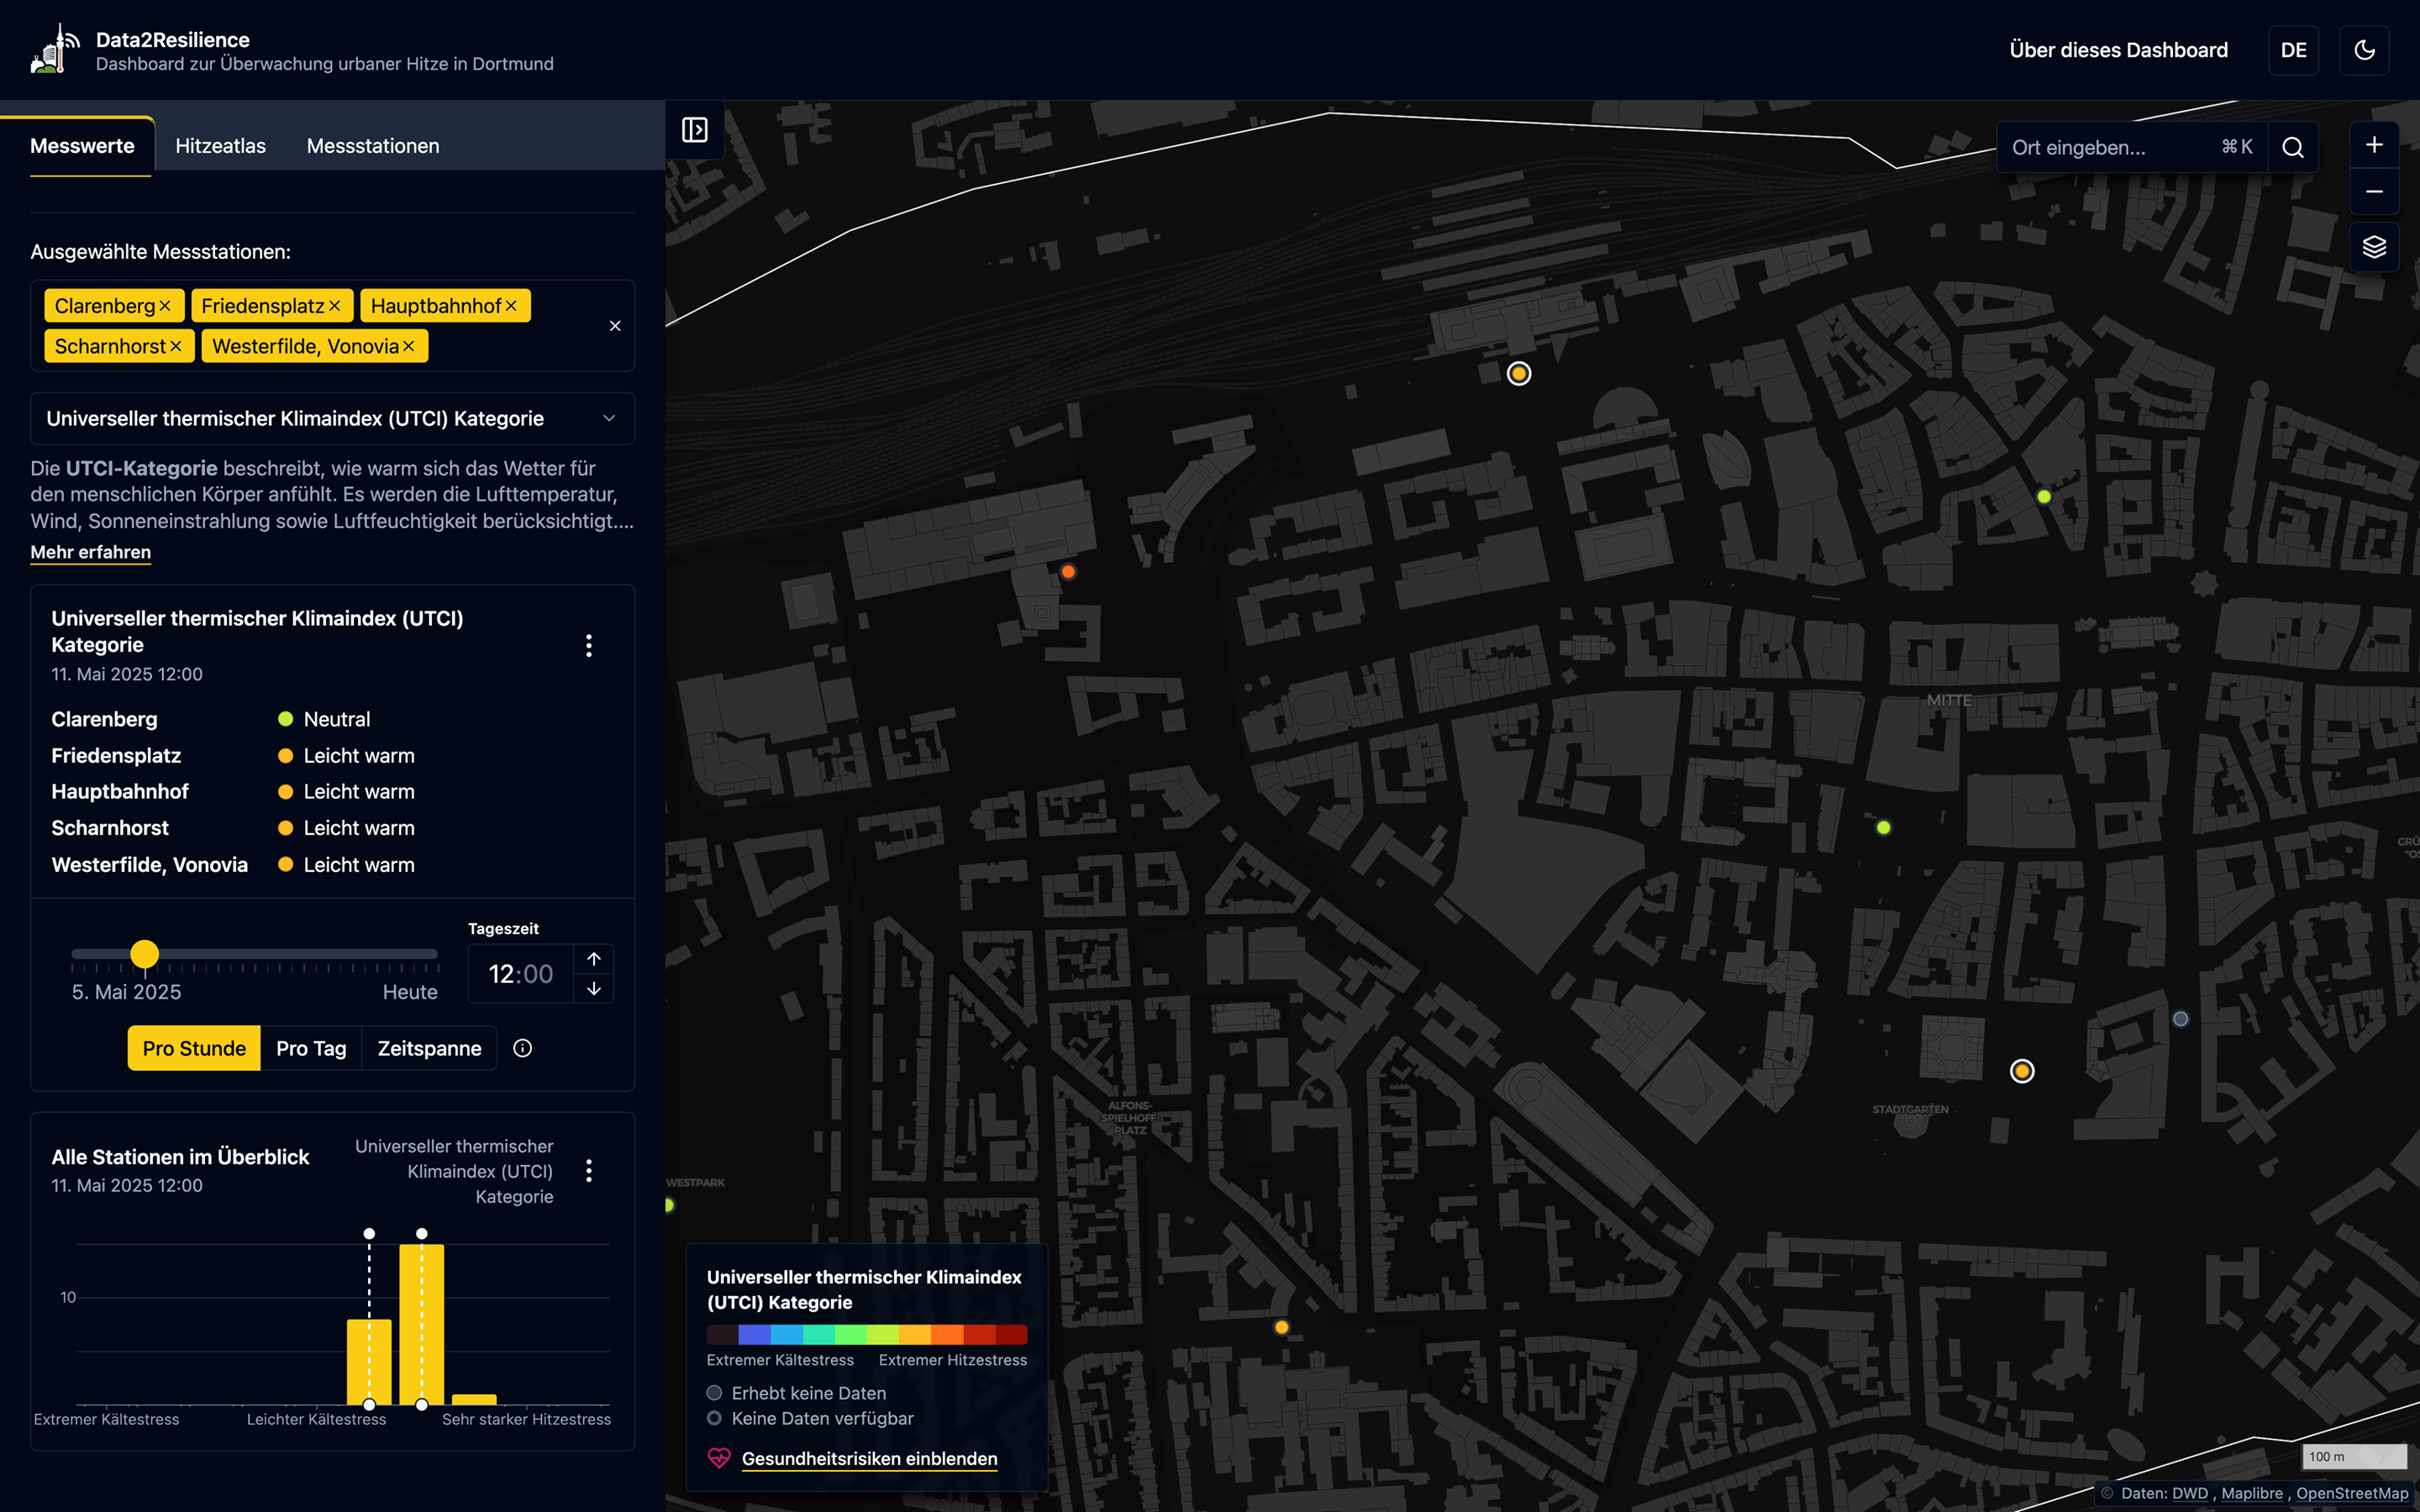
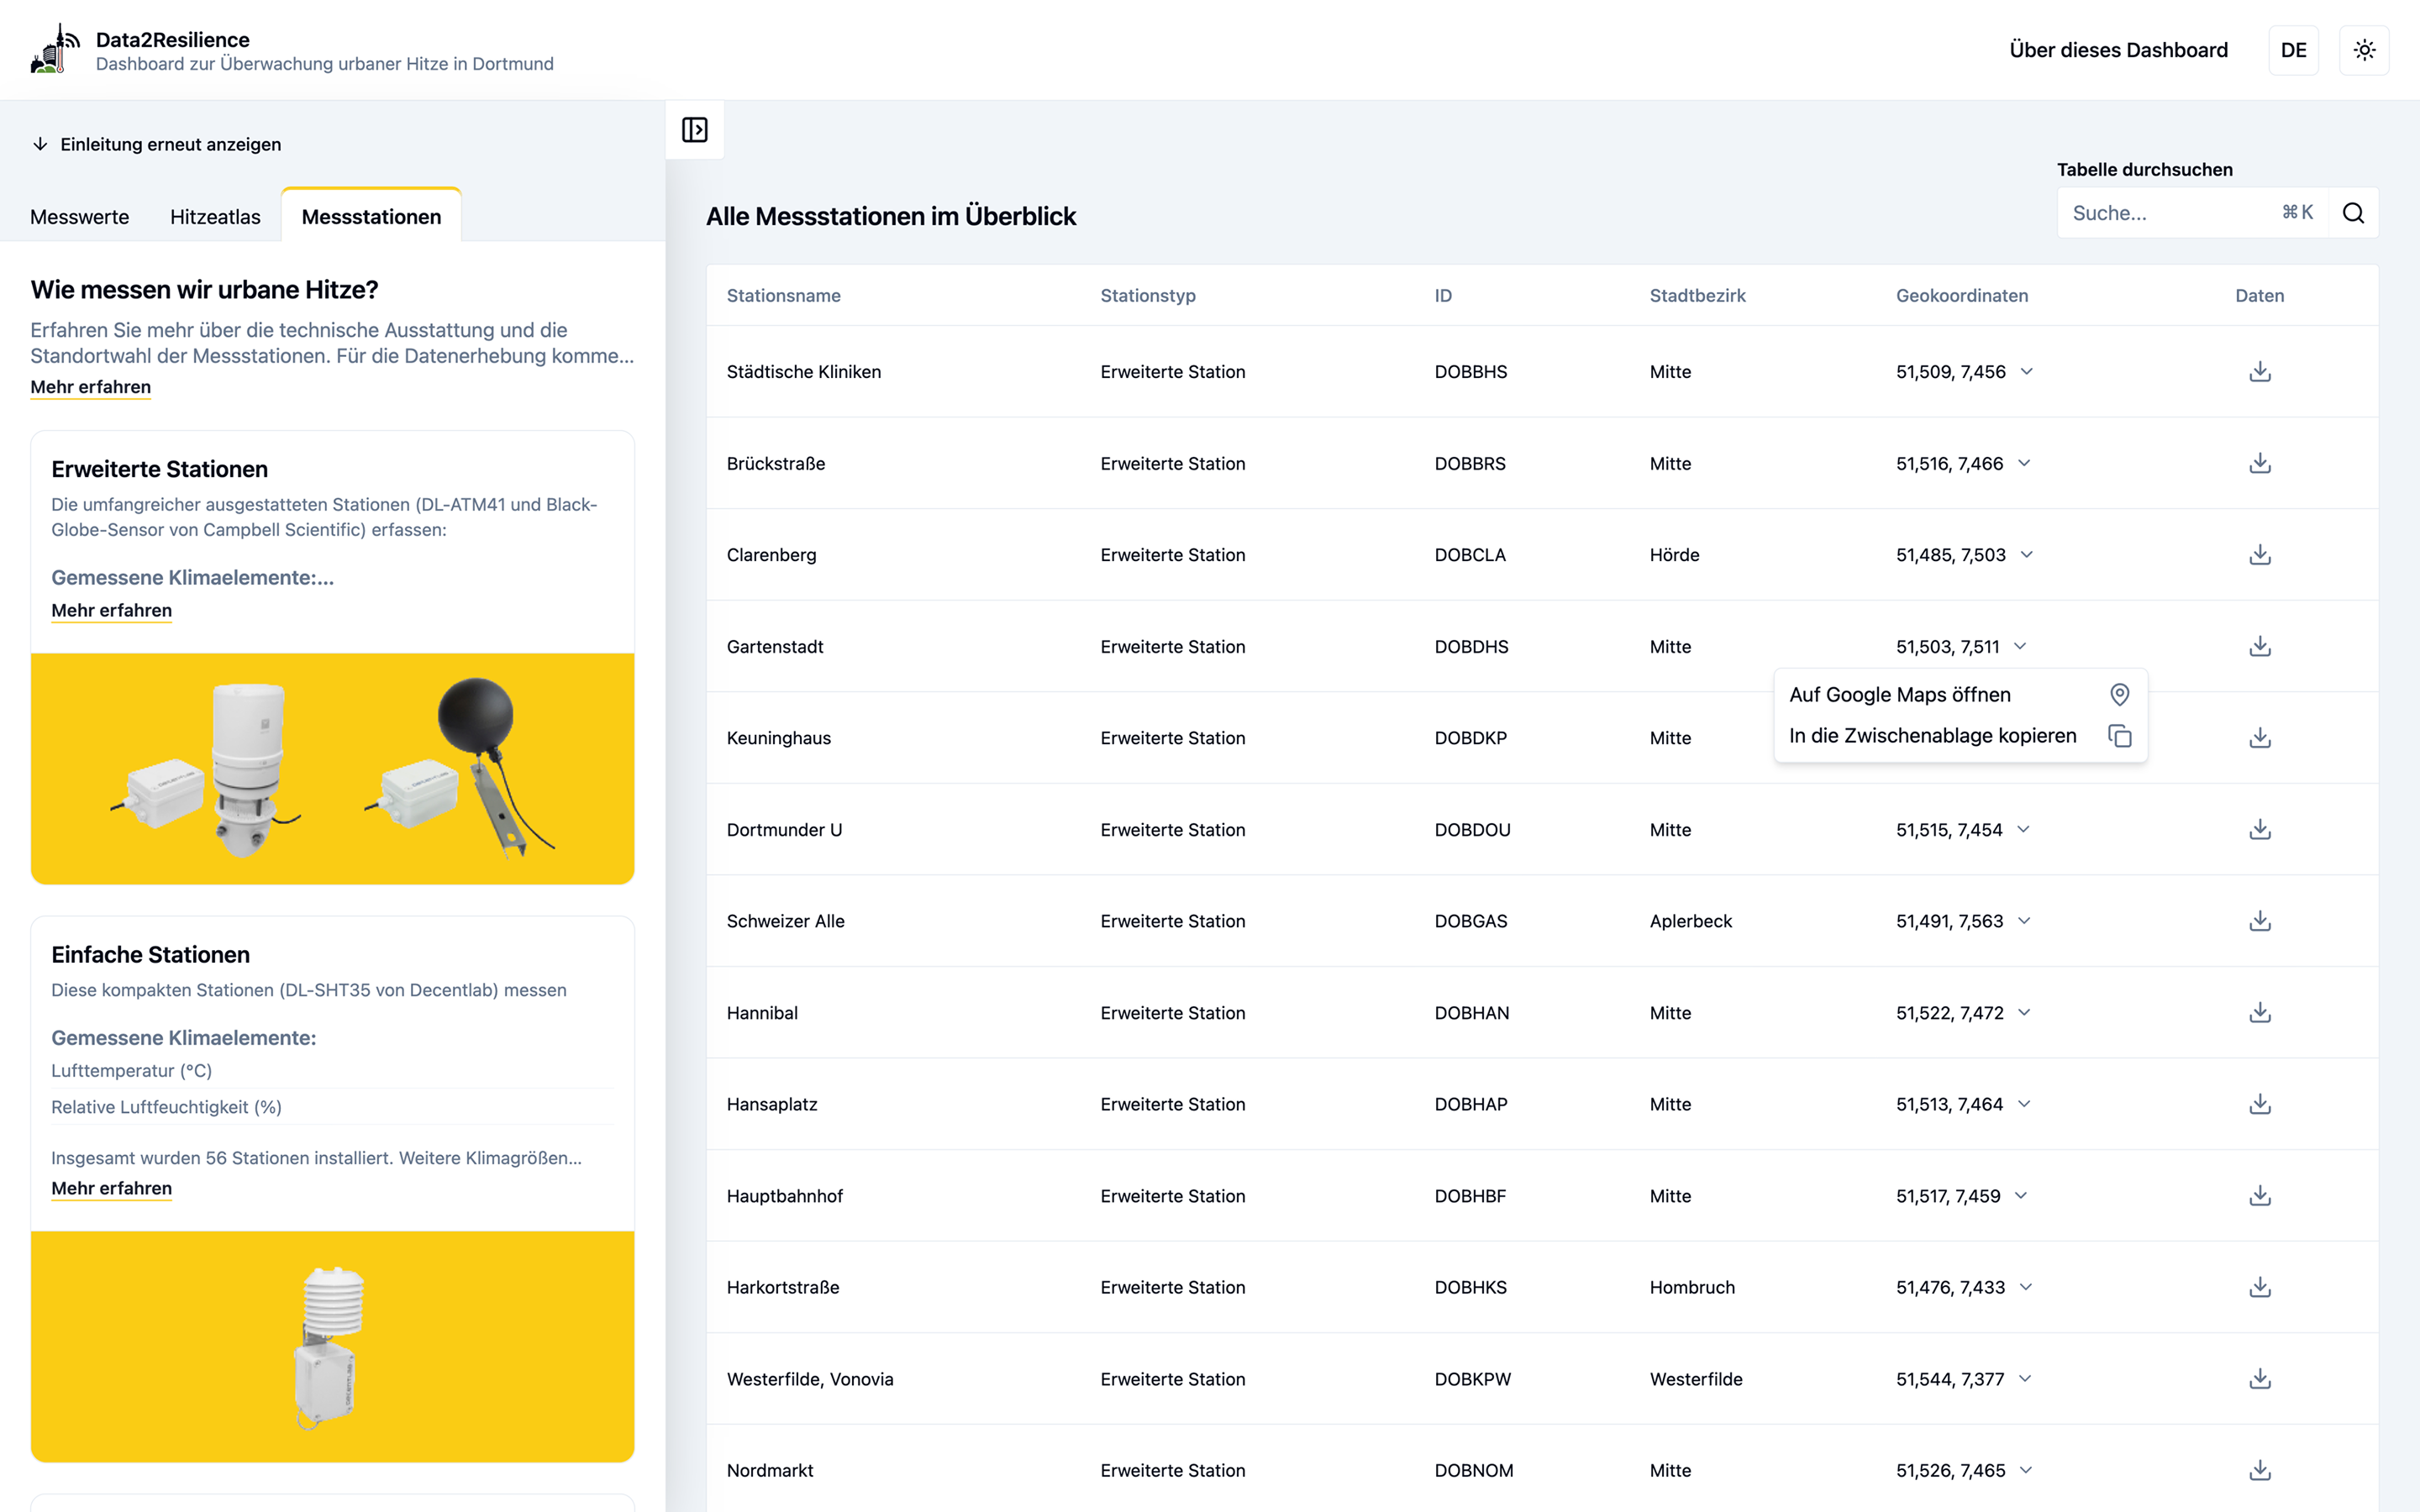
Data2Resilience is an interactive dashboard designed to visualize heat stress levels and other meteorological data across Dortmund. It was developed in collaboration with researchers from Ruhr University Bochum and Leibniz University Hannover, and was funded by the ICLEI Action Fund 2.0 and Google.org. The platform translates complex environmental data into accessible insights. The dashboard aims to support urban resilience strategies by making scientific data understandable for both experts and the general public.
The project began with a clear goal: to bridge the gap between scientific data and actionable urban insights. Working from a Figma prototype crafted by Alsino Skowronnek and his team at boldgeo, we translated design concepts into a functional, user-friendly interface. Regular feedback sessions with the RUB research team ensured that the dashboard met scientific standards while remaining accessible. Our workflow followed agile principles, using GitHub Projects to manage tasks and priorities, which allowed us to adapt quickly to new requirements and feedback.
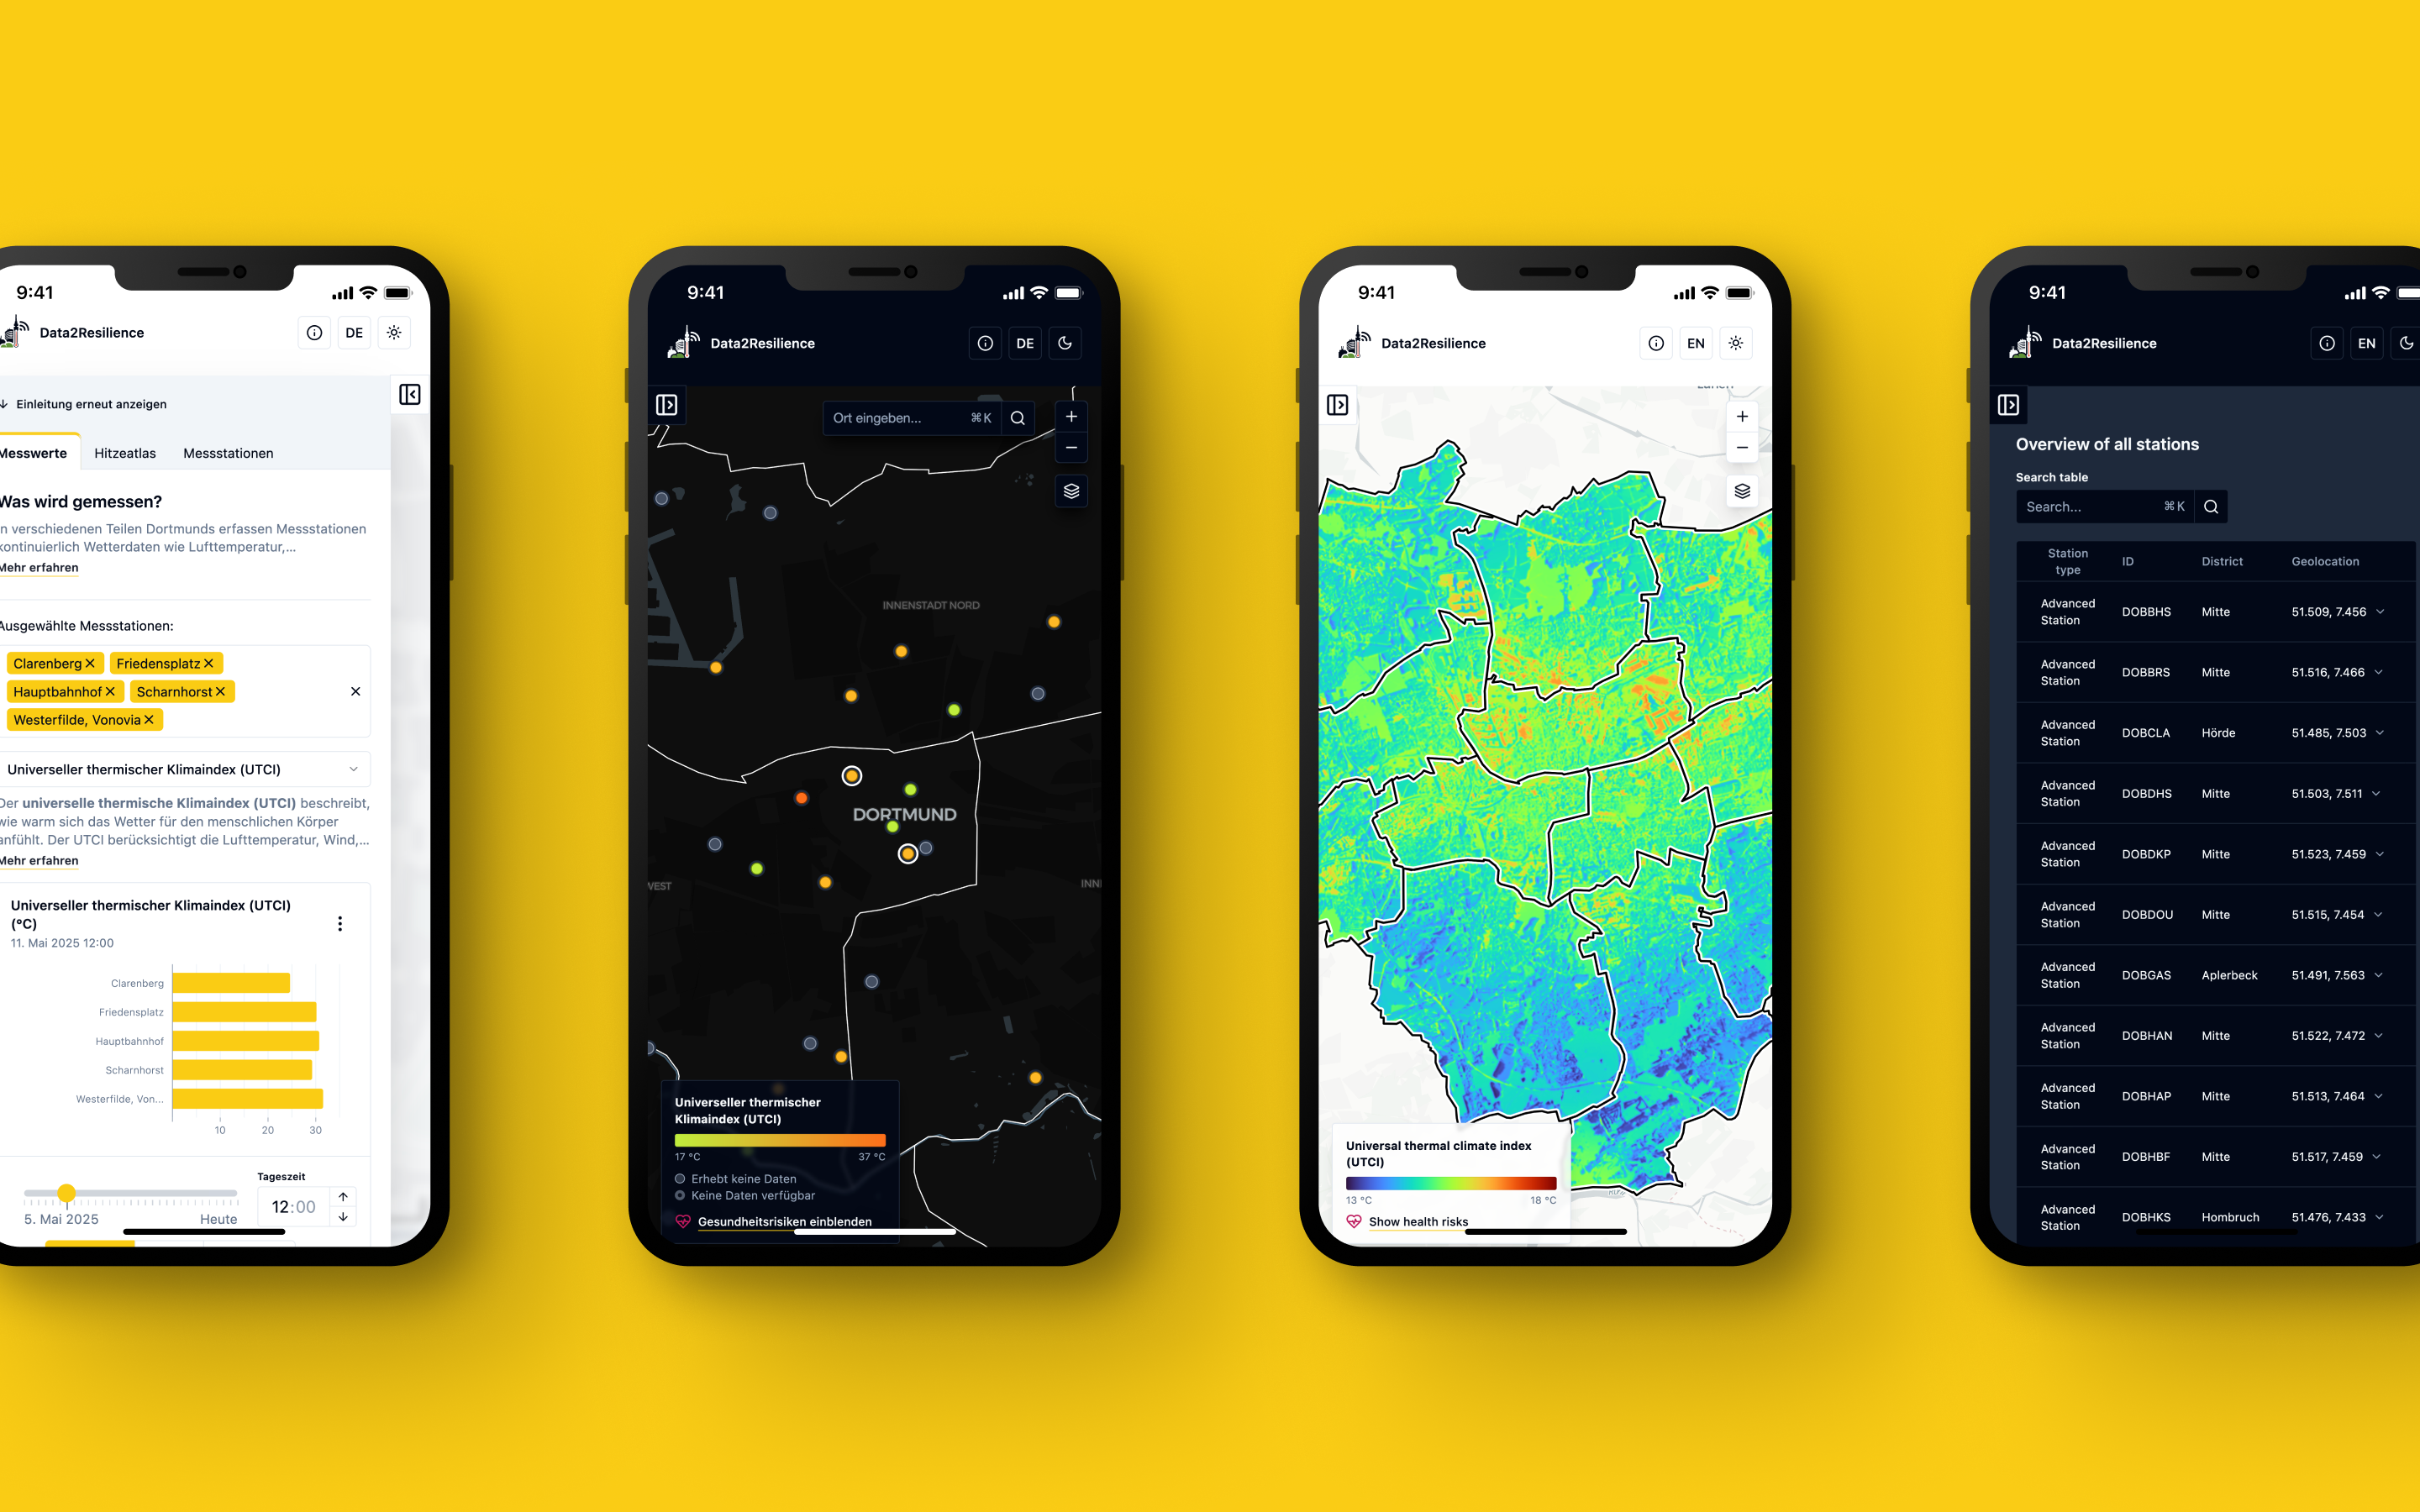
On the technical side, I developed the dashboard using SvelteKit and modern web technologies, focusing on performance, responsiveness, and cross-browser compatibility. A key challenge was integrating live data from the RUB API into clear, interactive visualizations without overwhelming the user. This required close collaboration with both the design and research teams to balance ease of use, scientific accuracy, and robust functionality.
My primary responsibility was the development of the dashboard application, turning design prototypes into a responsive, reliable web platform. I worked closely with Alsino on refining UX and UI details, ensuring the interface was intuitive and inclusive for a broad audience. Frequent coordination with the RUB team allowed for seamless integration of their data and scientific requirements. This project deepened my experience in collaborative, research-driven environments and strengthened my skills in building accessible, data-rich web applications.
*Annual review report* for CityLAB Berlin for the year 2024
Microsite 2025

*Media monitoring dashboard* helping activist organisations to raise awareness on their campaigns
Interactive Dashboard 2024

*Website* for Berlins Open Data Information Office
Website 2024